Verification of Aberrational Correction on Swarm

This document justifies the correctness of the aberrational correction of the Swarm attitude data from the Star Tracker (STR).

The three STR Camera Head Units (CHU) are mounted nearly perfectly perpendicular to each other. This implies, that if the aberrational correction of one head, CHUi, is perpendicular to the boresight of another head, CHUj, (and hence not visible in the inter-boresight angle, IBA, between the heads i and j) then it is parallel to the boresight of the third head, CHUk, and thus affects the IBA between heads i and k in full.

To further justify the correctness of the aberrational correction (AC), a series of verifications have been performed for various local times and various seasons. Below, a number of plots showing the effect of the AC is given. The plots visualize the effect of the AC for the three pairs of CHU's both as projections onto the corresponding plane of the CHU's and as IBA's of the CHU's. The AC effect is computed as the difference between the un-corrected attitude information provided in the Level 0 data (raw) and the corrected attitude information (corr - extracted from within the Level 1b Processor). These data are available as MATLAB save files containing the following variables:

Name
Type
Description
t nx1 double
Time instants of data. MATLAB times (datenum).
pos
nx3 double
Satellite positions, ITRF, Cartesian, metres
chu

1x3 struct
Structures holding information for the three heads
q_raw
nx4 double
Uncorrected attitude (quaternion), from Level 0
valid
nx1 logical
True, if attitude information is valid
residual
nx1 double
Residual of attitude solution compared to on-board star catalogue, arc-seconds
q_corr
nx4 double
Corrected attitude (quaternion), from Level 1b processing


The following plots show (click for larger images or here for all plots in full size):
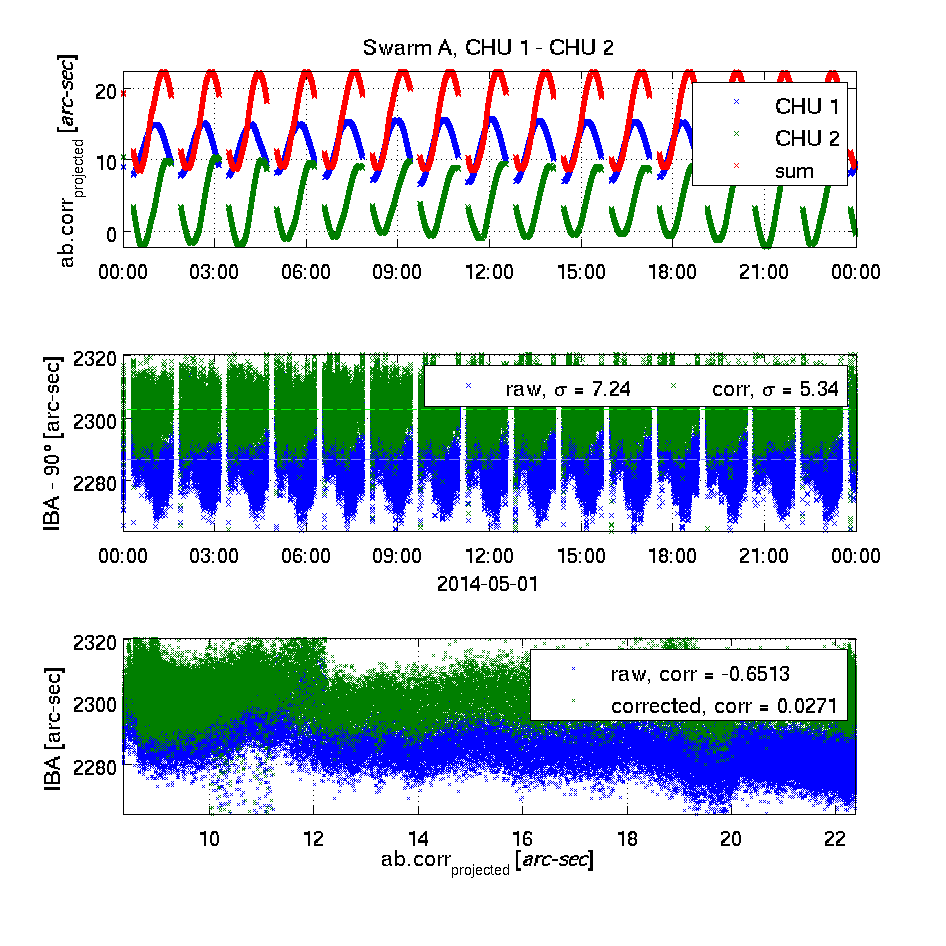
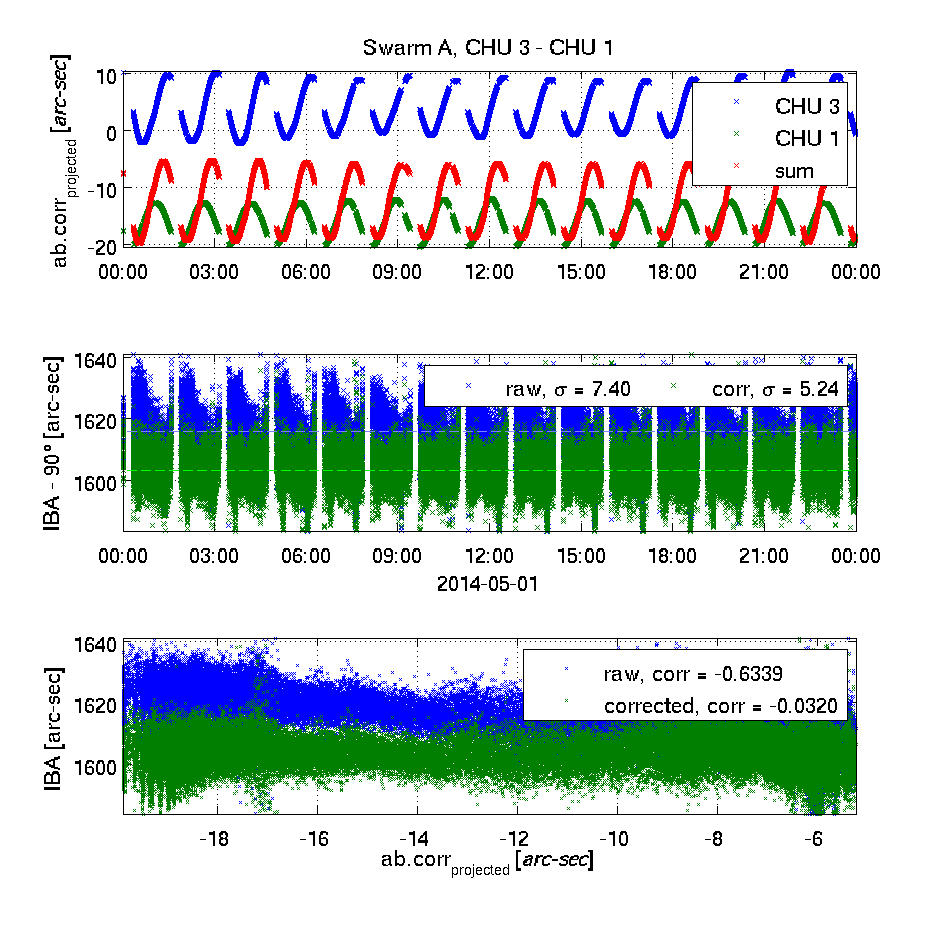
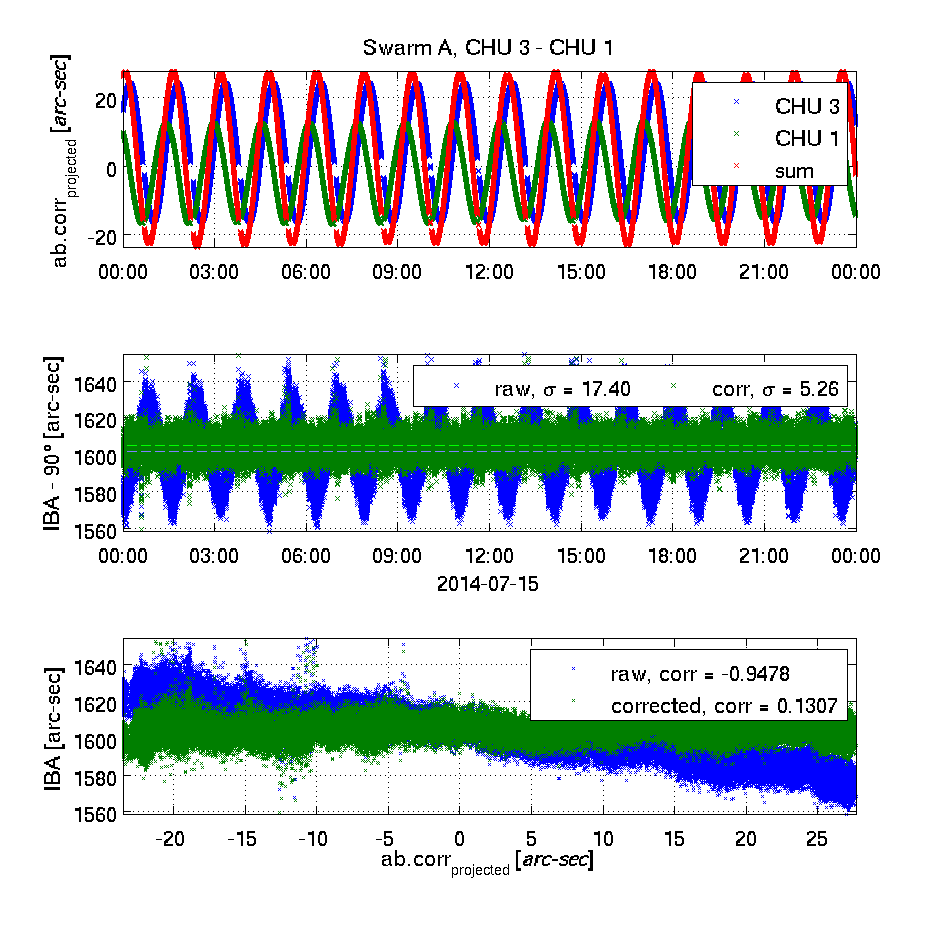
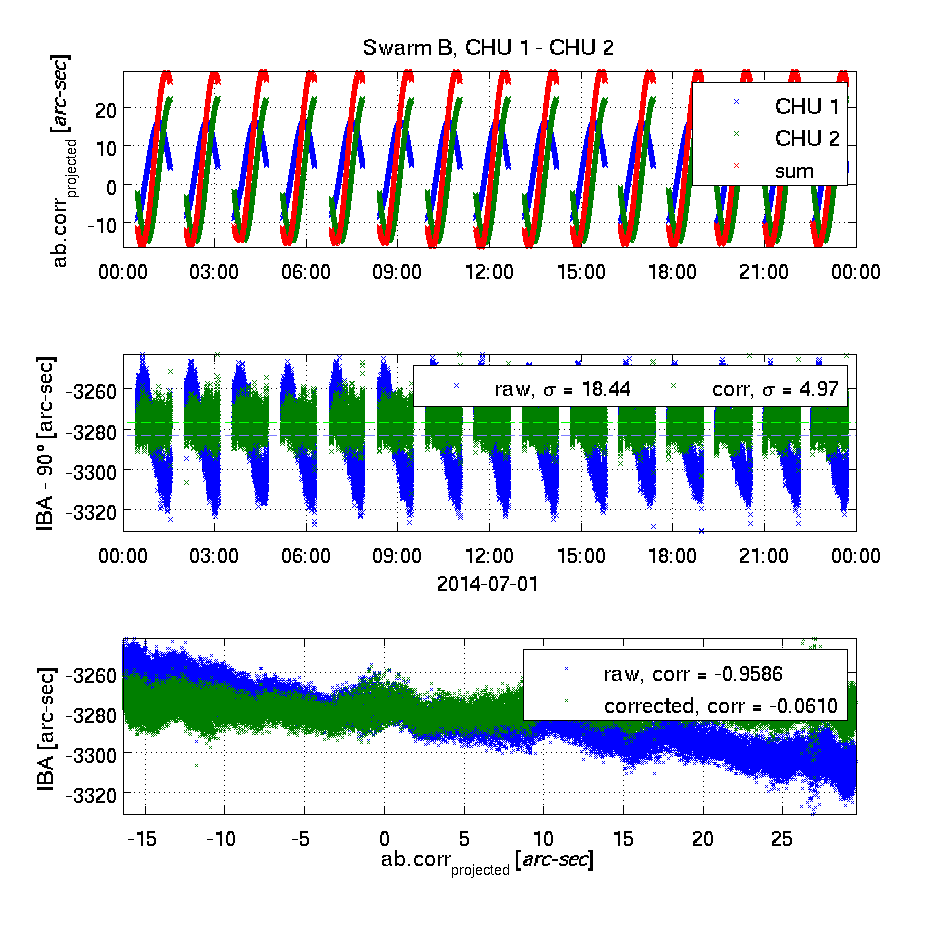
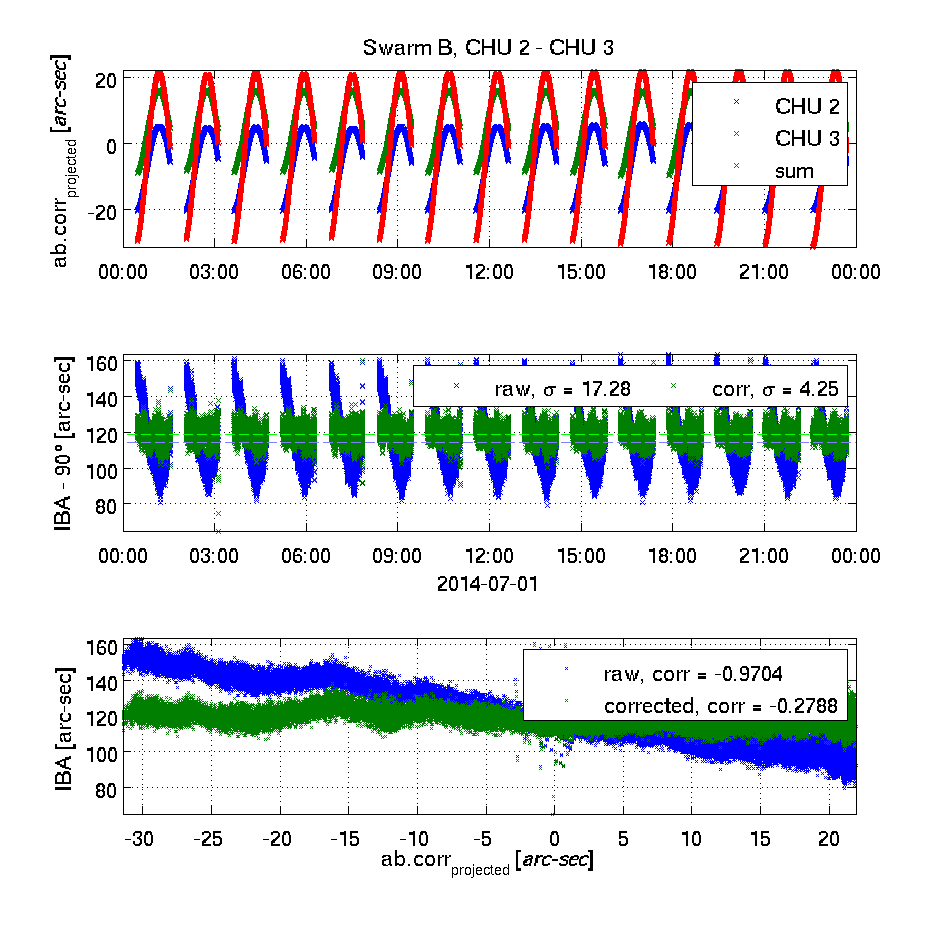
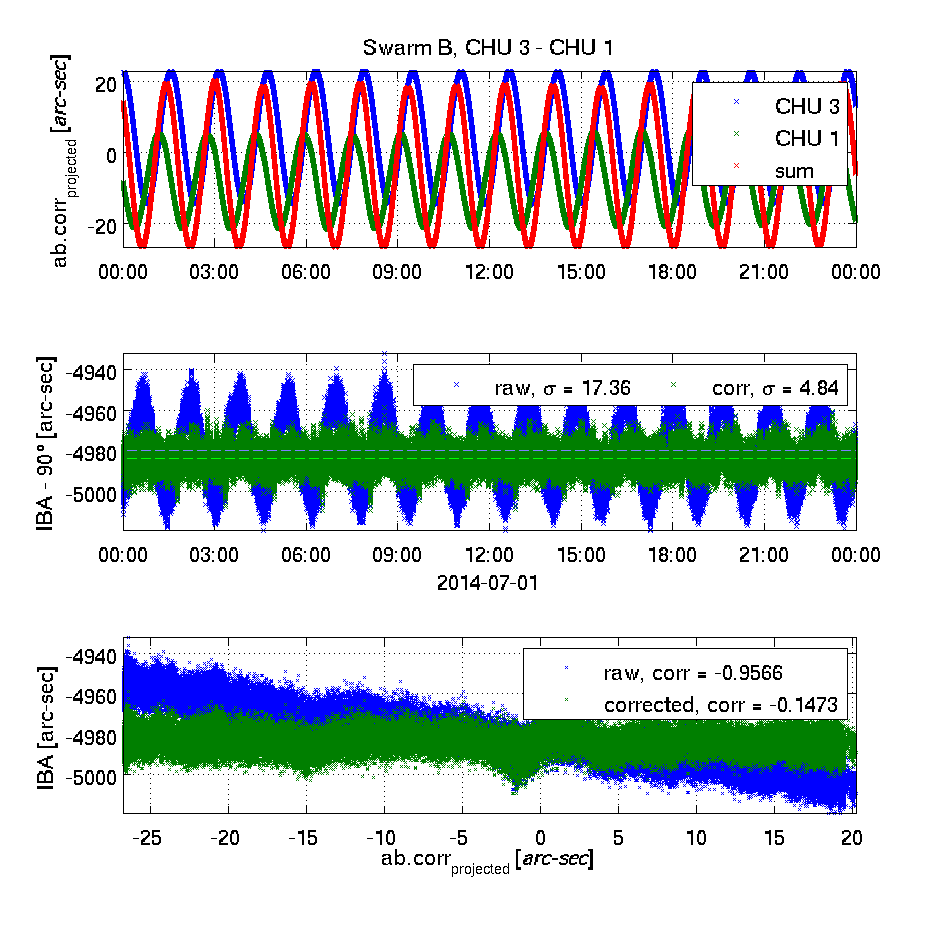
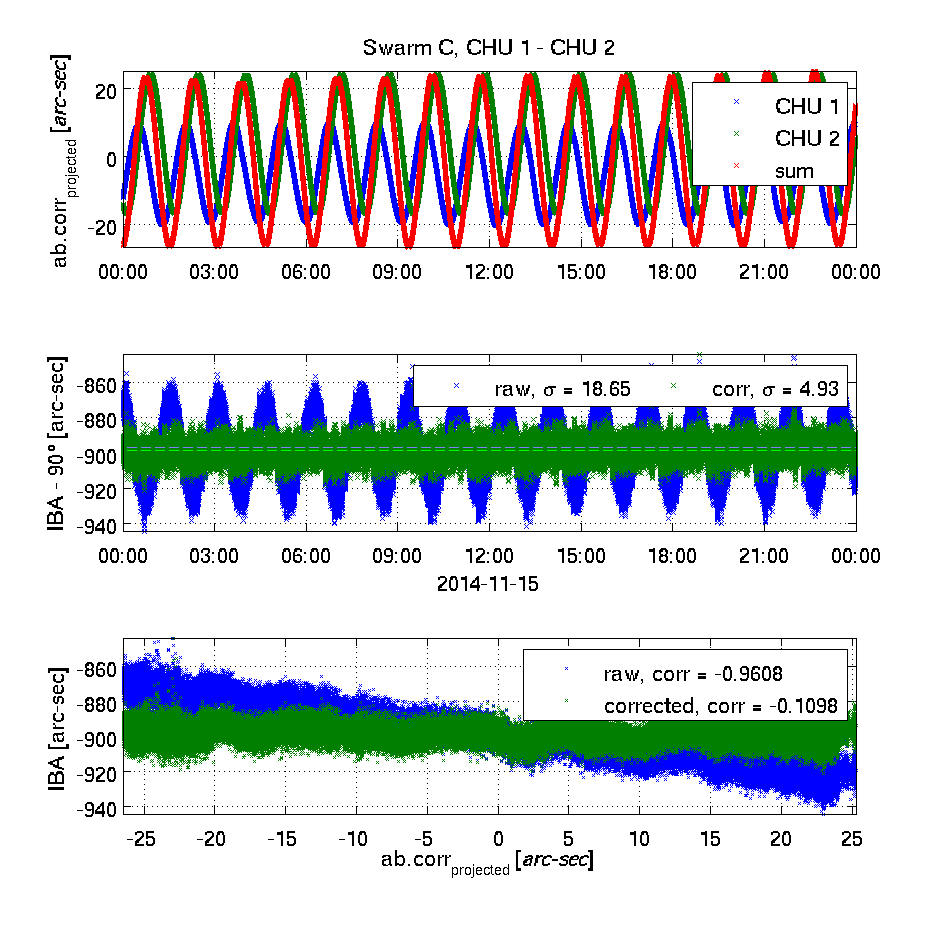
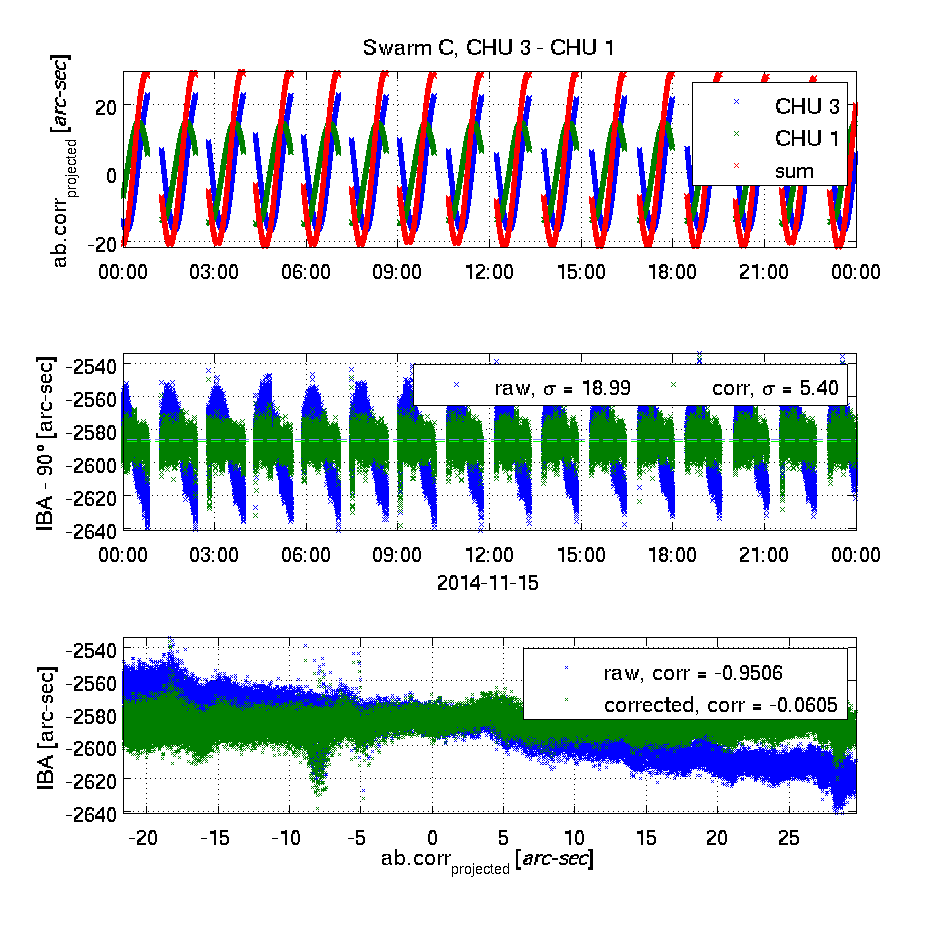
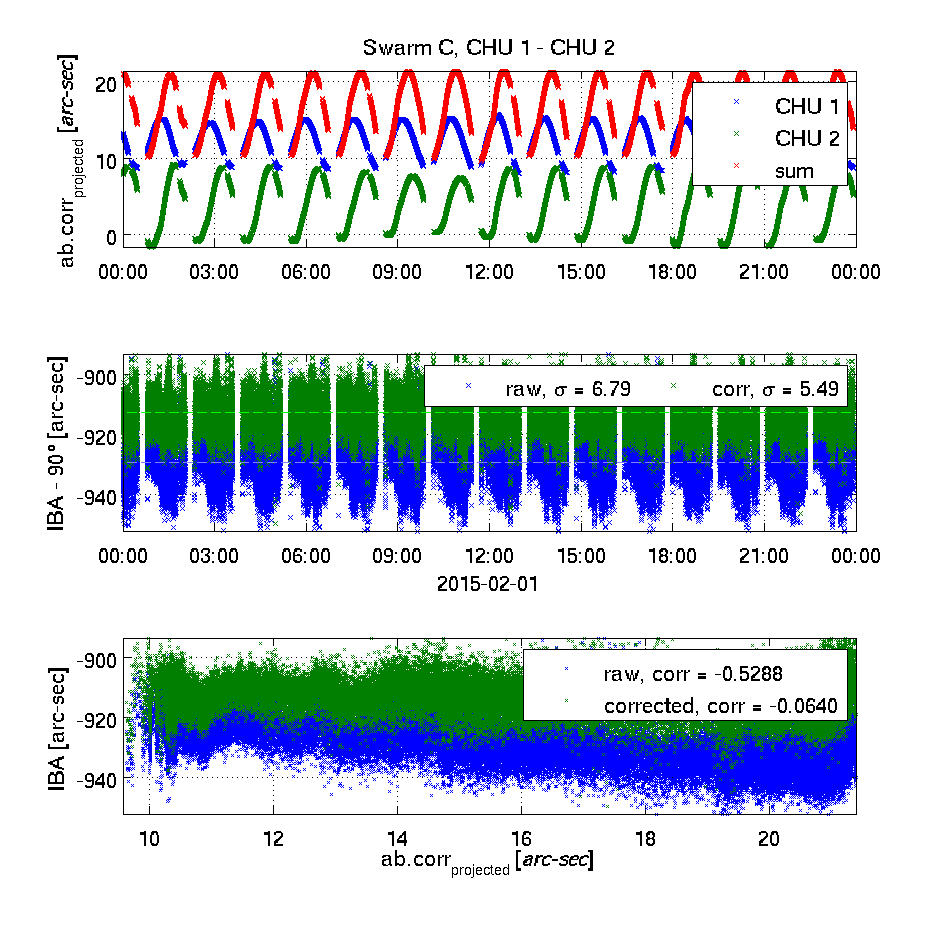
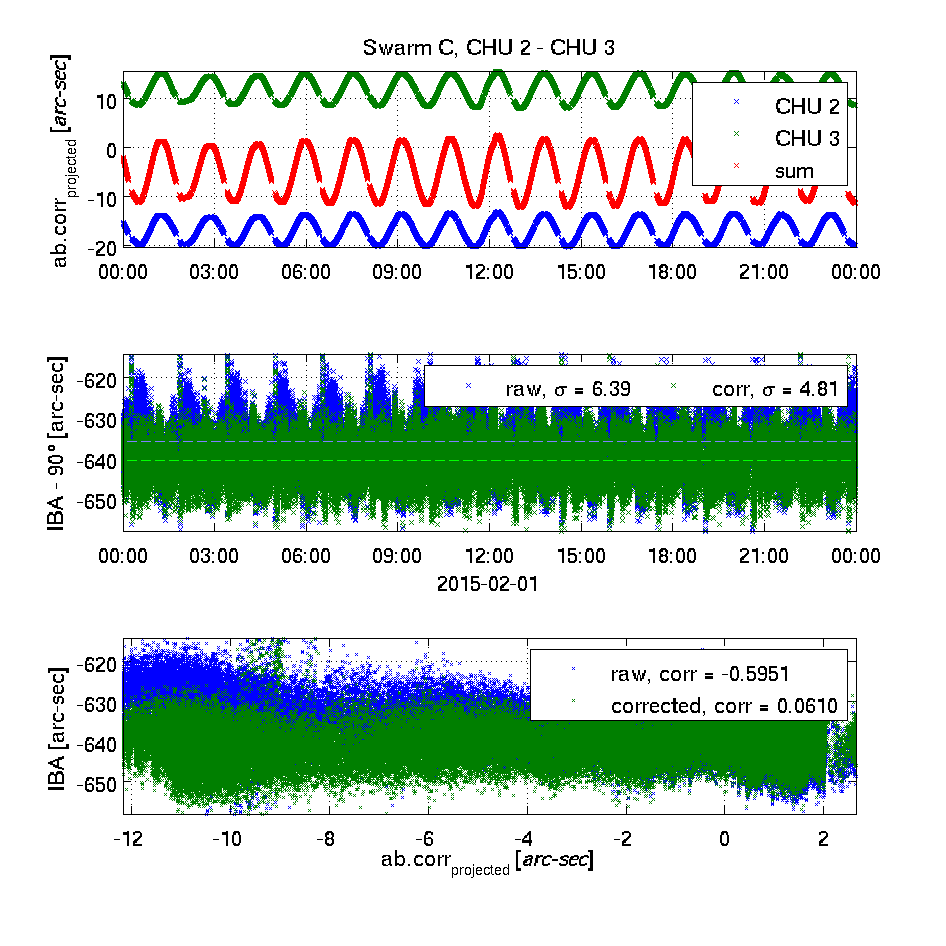
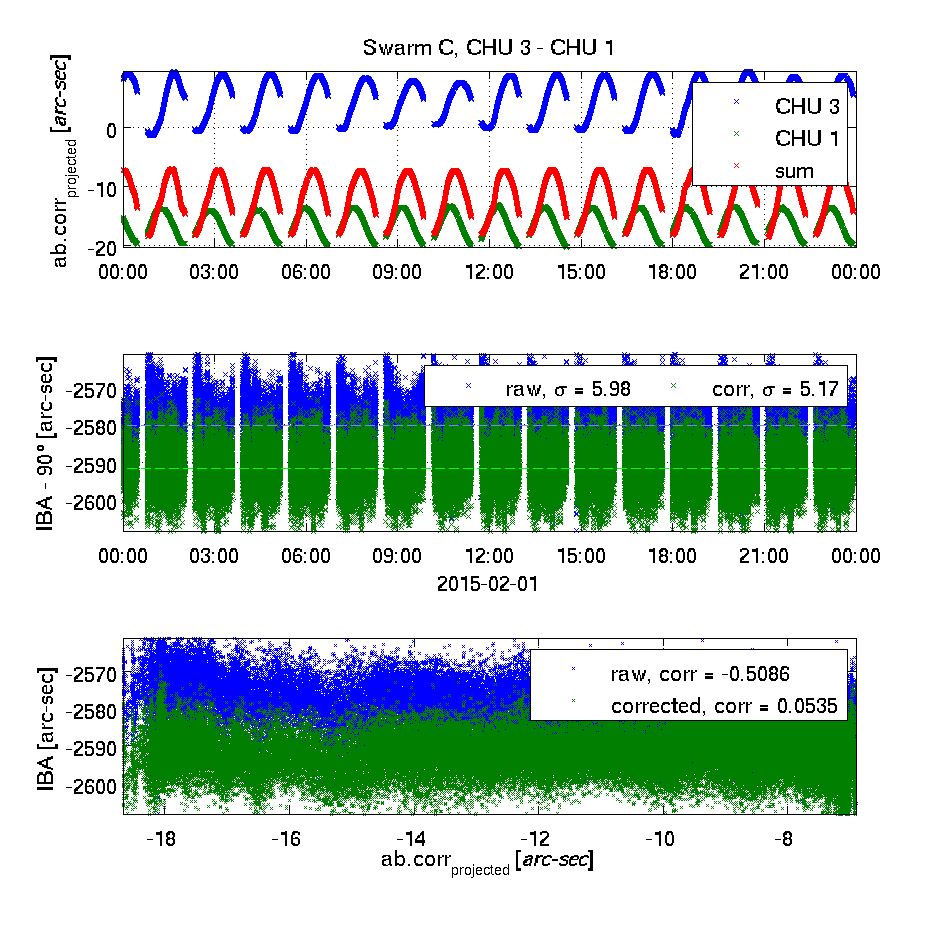
The top plot shows the effect of the Level 1b aberrational correction projected into the plane of the two camera heads being investigated - in blue and green respectively. Positive values indicate a correction away from the other head's boresight. In red, the sum of the two is plotted. The unit is approximated arc-seconds.

The middle plot shows the inter-boresight angles (IBA - 90°) for the uncorrected (raw, in blue) and the corrected (in green) attitude information. The mean values are shown as dashed lines (in cyan and light green respectively); the weighted standard deviations are given in the legends.

The bottom plot shows the correlation between the un-corrected and corrected IBA's and the sum of the projected aberrational corrections (the red curve in the top plot) - the correlation coefficients are given.

This high correlation between un-corrected IBA's and sums of projected aberrational corrections as well as the lack of correlation for the corrected IBA's clearly demonstrates the correctness of the applied aberrational correction.

Swarm Alpha, 2014-05-01, data

Swarm_A_CHU_12_140501 Swarm_A_CHU_23_140501 Swarm_A_CHU_31_140501

Swarm Alpha, 2014-07-15, data

Swarm_A_CHU_12_140715 Swarm_A_CHU_23_140715 Swarm_A_CHU_31_140715

Swarm Bravo, 2014-07-01, data

Swarm_B_CHU_12_140701 Swarm_B_CHU_23_140701 Swarm_B_CHU_31_140701

Swarm Charlie, 2014-11-15, data

Swarm_C_CHU_12_141115 Swarm_C_CHU_23_141115 Swarm_C_CHU_31_141115

Swarm Charlie, 2015-02-01, data

Swarm_C_CHU_12_150201 Swarm_C_CHU_23_150201 Swarm_C_CHU_31_150201