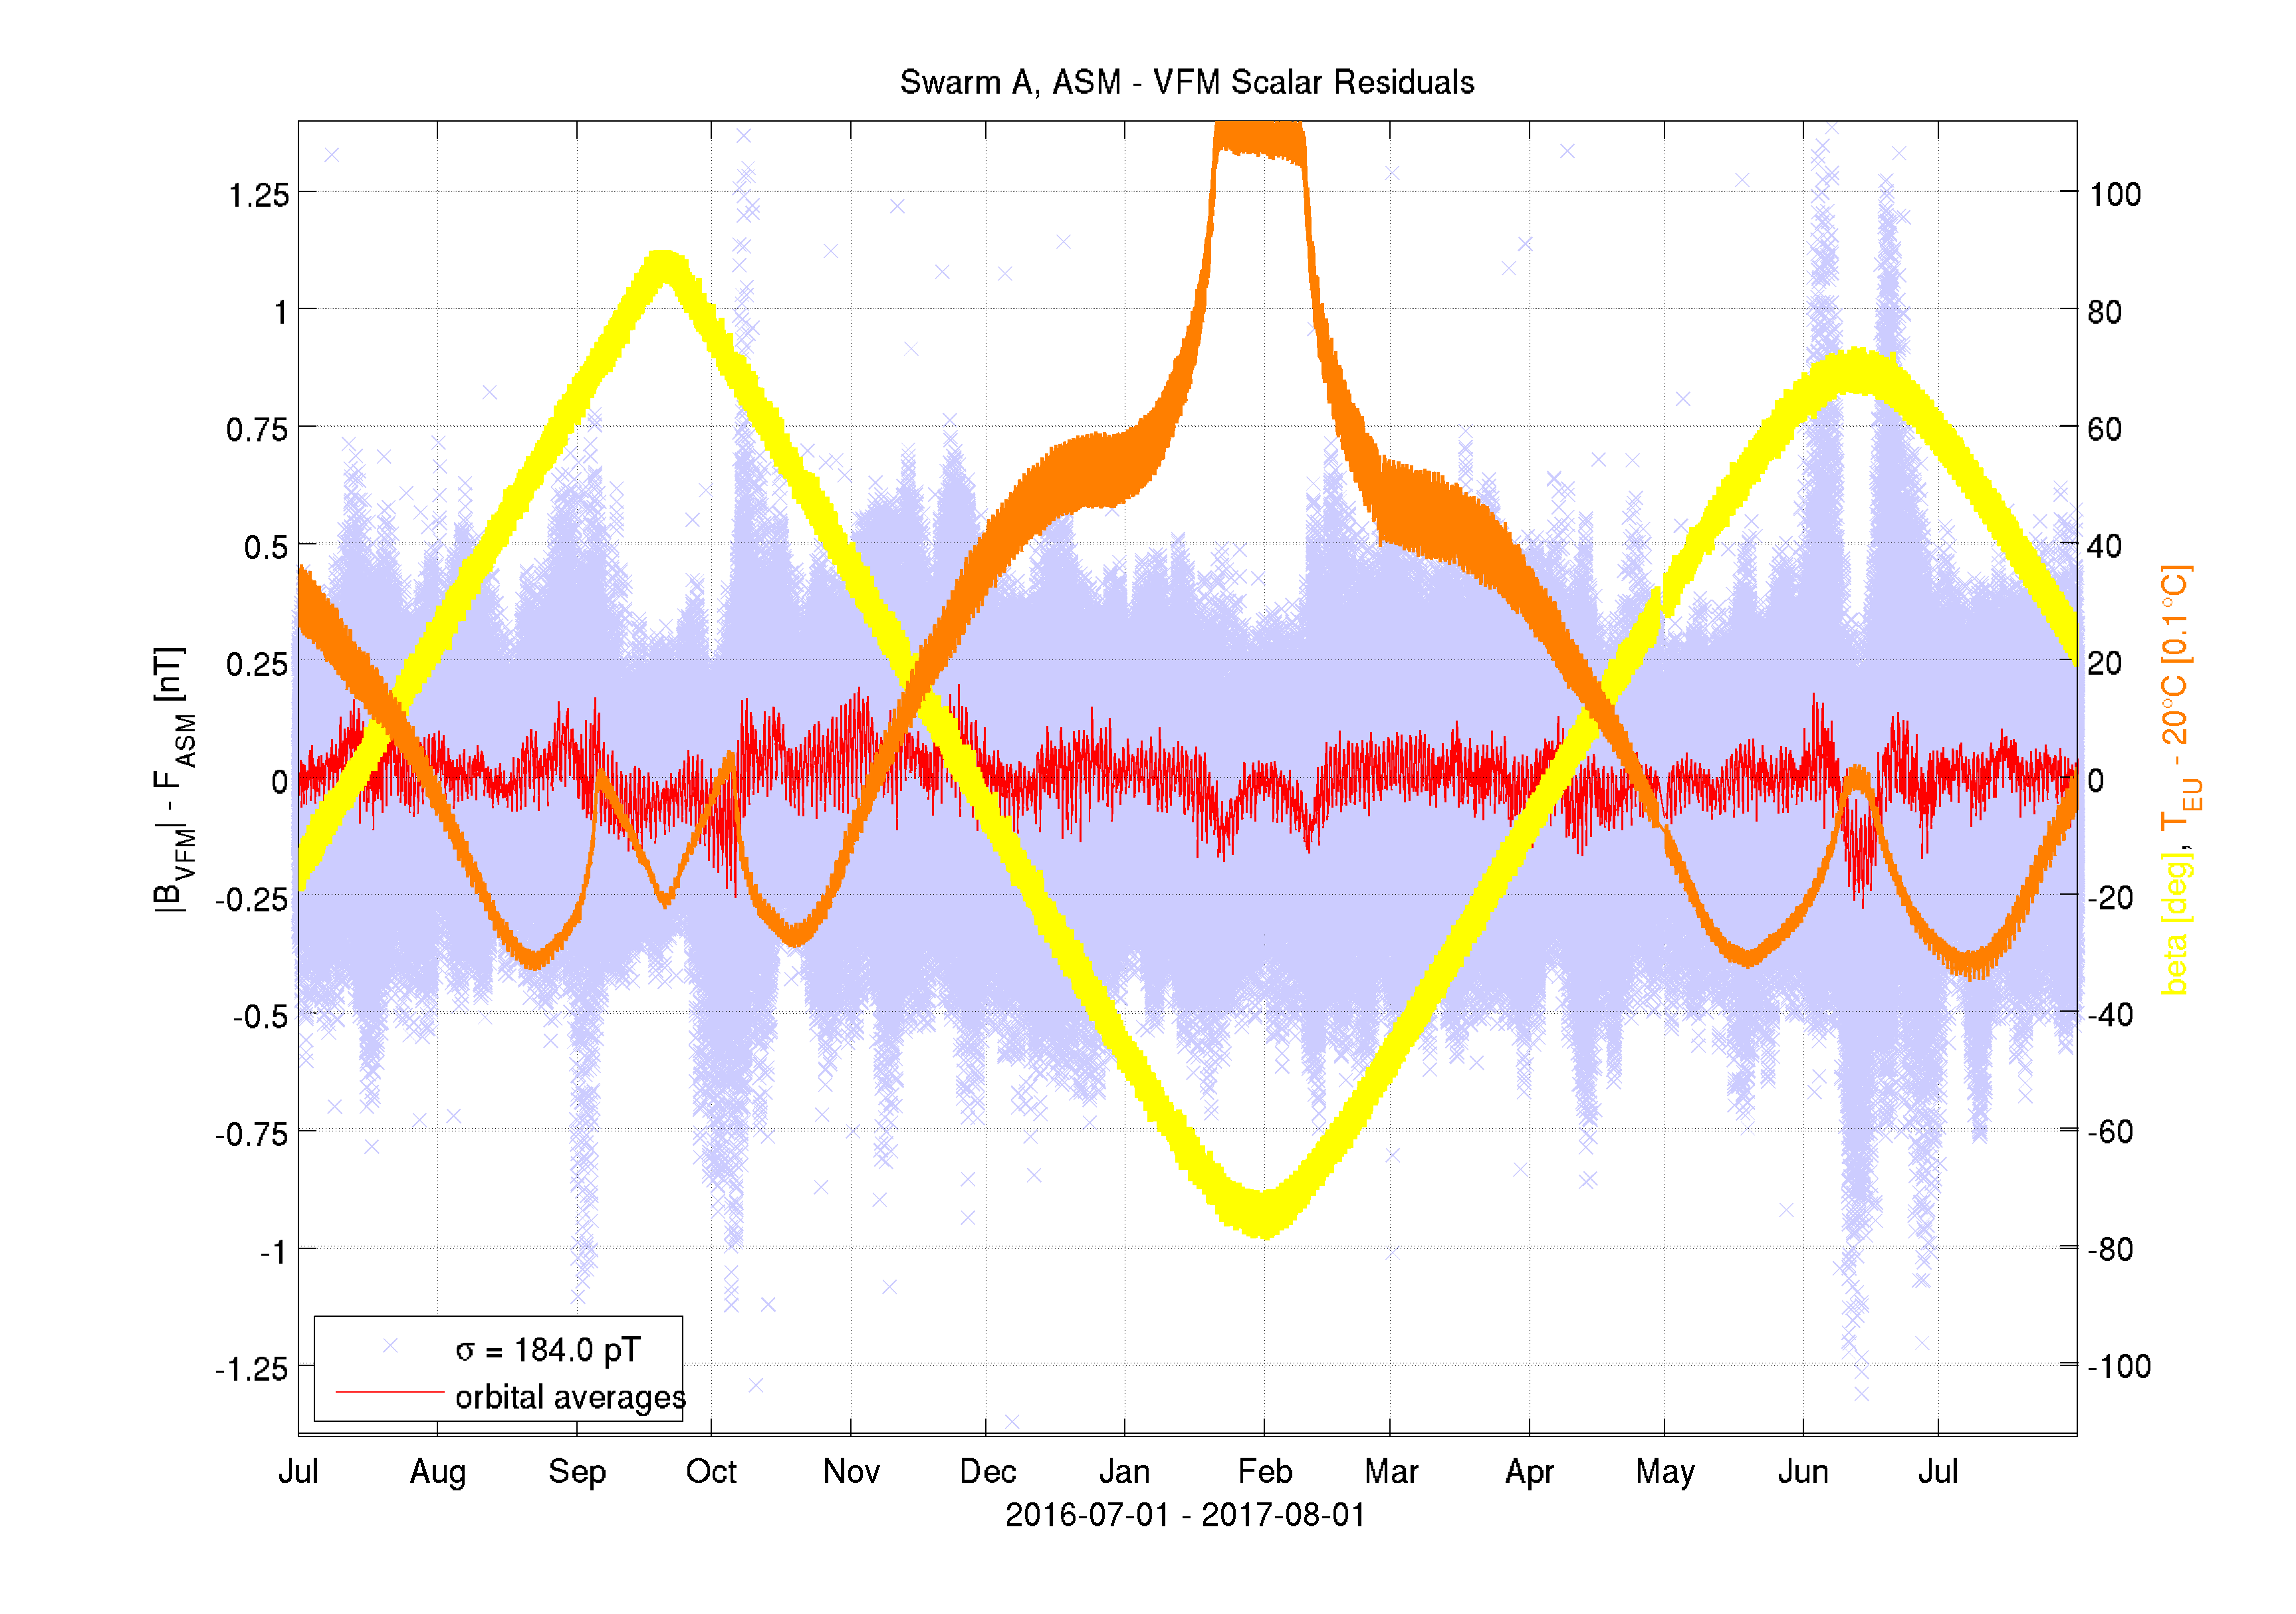
Detailed investigations of the residuals from the recent magnetic characterisation and calibration of Swarm have revealed some unmodeled features in the transition between sun-lit and eclipse parts of the orbit. This is most noticeable in the scalar residuals from Swarm Alpha around the June 2017 dawn-dusk orbit phase, see figure below. There are distinct, upward peaks just before and after the full sun-lit period and a local low inside the period. These peaks are clearly not correlated with the solar incident beta angle (in yellow) nor the VFM electronic unit temperature (in orange). The same pattern is also seen in the dawn-dusk phase in September 2016 and to less extent in beginning of February 2017.
The current model of the Sun induced magnetic disturbance, dBSun, assumes a unique mapping of the Sun incidence angles, alpha and beta, into dBSun. However, in the transitions in and out of eclipse (which occurs in a ring in the alpha-beta map) some combinations of alpha and beta angles occur both in sun-lit and in eclipse situations, hence different values of dBSun are expected for such alpha-beta combinations, but this is not possible with the current model.
This deficiency can be circumvented by means of a "squeeze" of the eclipse part of the alpha-beta map. This squeeze is illustrated in the figure below: all data points taken in eclipse (the blue part) are squeezed a little bit (5%) towards the center of the eclipse region - indicated by the red arrows in the figure. This squeeze takes the light-blue points (true alpha,beta points wihtin eclipse) into the dark-blue points (squeezed eclipse) thereby separating the eclipse data from the sun-lit data (which are shown in yellow).
Applying this eclipse squeeze and estimating the model parameteres as previous the major part of the discrepancies near dawn-dusk orbits is removed. The resulting scalar residuals are shown in the plots below; the detailed plot reveal some data points still having higher residuals, these may be data not correctly classified as sun-lit or in eclipse - or possibly data acquired in the penumbra.